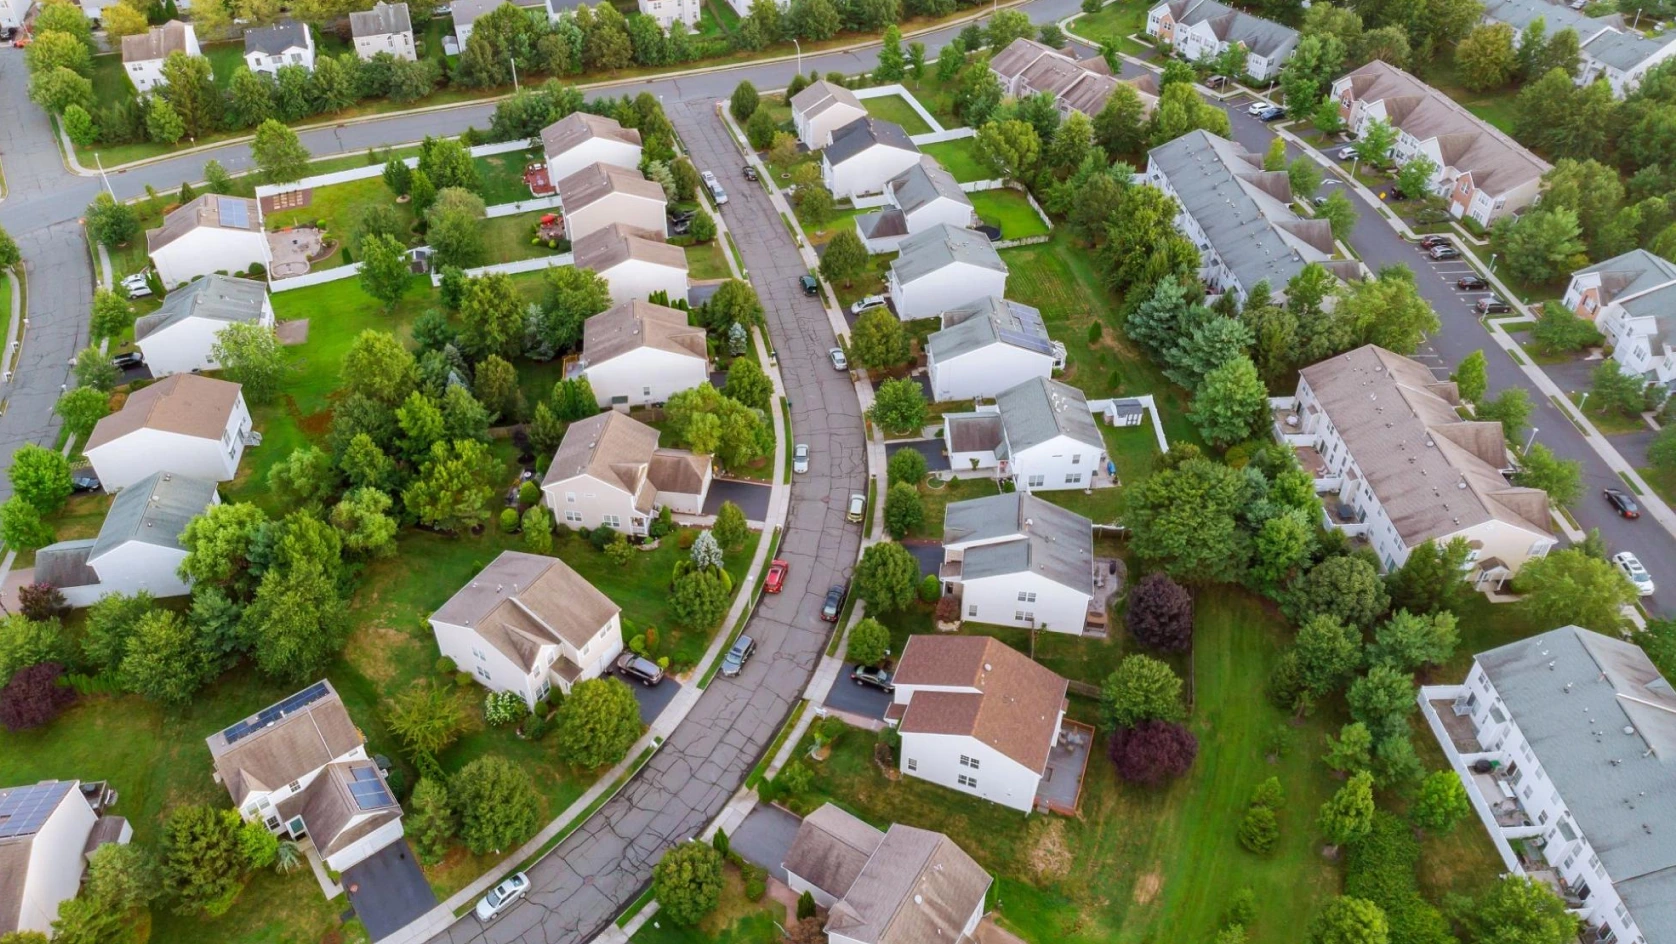


Current market data revealing why single-family rentals remain the dominant asset class for landlords and real estate investors
The single-family rental market contains 15.7 million homes across the United States, representing one of the largest segments of the residential real estate investment landscape. Despite media attention on institutional buyers, nearly 90% of these properties remain in the hands of individual landlords managing small portfolios. For investors tracking finances across multiple properties, landlord banking solutions that organize income and expenses by property and entity have become essential tools for maintaining clarity as portfolios grow.
Own your time,
not just your properties
Make your finances work harder, so you don’t have to.


Key takeaways
- Mom-and-pop landlords dominate the market: 89.6% of single-family rentals are owned by investors with 1 to 5 properties, not institutional buyers
- Rent growth has normalized: Annual single-family rent growth fell to 1.2% in December 2025, reaching 15-year lows after years of rapid increases
- Regional performance varies dramatically: Chicago led with 4.8% rent growth while Dallas posted -1.2% declines, underscoring the importance of market selection
- Affordability pressures persist: Home prices have grown 156% since 2000 while median income grew only 99%, pushing more households toward renting
- Investor sentiment remains strong: 71% of property investors expressed optimism about rental profitability heading into 2025
- Occupancy stays resilient: Single-family rentals maintain 94% occupancy, matching traditional multifamily performance
The current landscape of single-family rental homes
The single-family rental sector represents a substantial portion of the American housing market. Understanding its scale helps investors recognize both the opportunity and the competition they face when building portfolios.
1. 15.7 million single-family rental homes exist in the United States
BatchData analysis reveals there are 15.7 million single-family rental homes across the country. This represents approximately 18% of the total 86.5 million single-family homes in the U.S., with the remainder being owner-occupied.
2. Single-family rentals account for 32.4% of all rental stock
According to the Urban Institute Housing Finance Policy Center, one-unit rental properties represent 32.4% of the total rental stock in the United States. This makes SFRs the second-largest rental category after large apartment buildings.
3. The private fund market value reached $7.5 billion in Q2 2025
Single-family rental assets held in privately held funds reached a market value of $7.5 billion in Q2 2025, representing a 39% increase from the $5.4 billion recorded in Q2 2024. This growth signals continued institutional appetite for the asset class.
Single-family rental market performance: rent prices and growth trends
Rent growth patterns reveal important shifts in market dynamics. After several years of rapid increases, the single-family rental sector has entered a period of stabilization that affects how investors should approach rent collection and pricing strategies.
4. Annual rent growth slowed to 1.2% in December 2025
The Cotality Single-Family Rent Index shows that single-family rent prices increased 1.2% year-over-year in December 2025. This represents a significant deceleration from the 2.5% growth recorded in December 2024.
5. Rent growth reached 15-year lows at the end of 2025
Annual single-family rent growth is now near 15-year lows, marking the lowest growth rate since the early 2010s. This normalization follows the exceptional rent increases seen during 2021 and 2022.
6. 35 of 50 largest metros posted slower annual rent growth
Data from Cotality indicates that 35 of the 50 largest metros posted slower annual rent growth in December 2025 compared to December 2024. Only 15 major markets maintained or improved their growth rates.
7. Single-family rents achieved 5.5% 10-year CAGR through 2025
Over the past decade, single-family rental rents achieved approximately 5.5% compound annual growth, compared to 4.2% for traditional multifamily properties. This outperformance demonstrates the asset class's appeal to long-term investors.
Regional performance: where rent growth is strongest and weakest
Geographic variation in rent performance highlights why market selection matters for real estate investors. Some metros continue experiencing growth while others face declining rents.
8. Chicago led all metros with 4.8% rent growth
Chicago recorded the highest single-family rent growth at 4.8% in December 2025, significantly outpacing the national average. Midwest markets generally showed more resilience than Sun Belt metros.
9. Dallas posted the lowest growth at negative 1.2%
At the opposite end of the spectrum, Dallas experienced negative 1.2% rent growth in December 2025, the weakest performance among major metros. Rapid new construction has increased supply pressure in the Texas market.
10. 18 cities recorded outright annual rent declines
According to Cotality data, 18 U.S. cities recorded outright annual declines in single-family rents in December 2025. Eight of these cities were in Florida, three in Texas, and two in Arizona.
11. High-end rentals increased 2.2% while low-end decreased 0.3%
The Cotality index reveals a divergence by price tier: high-end single-family rentals increased 2.2% year-over-year in December 2025, while low-end properties decreased by 0.3%. This suggests stronger demand in premium segments.
12. Miami rents increased 51% since the end of 2019
Despite recent cooling, Miami single-family rents rose 51%, roughly $900 per month, since the end of 2019. This cumulative gain illustrates the substantial appreciation that occurred during the pandemic migration to Florida.
Ownership structure: mom-and-pop landlords remain dominant
Contrary to popular narratives about institutional investors taking over the housing market, small landlords continue to own the vast majority of single-family rentals. This ownership pattern affects how investors compete and operate in local markets.
13. 89.6% of SFRs are owned by mom-and-pop landlords
BatchData analysis shows that 89.6% of single-family rentals are owned by "mom-and-pop" landlords who own between 1 and 5 properties. These individual investors form the backbone of the rental housing market.
14. Institutional investors own only 3.8% of SFR properties
The Urban Institute reports that institutional investors own approximately 574,000 single-family homes, representing just 3.8% of the 15.1 million total SFR properties. This share is far smaller than media coverage often suggests.
15. Atlanta has the highest institutional concentration at 25%
The U.S. Government Accountability Office found that institutional investors own 25% of Atlanta's single-family rental housing market, the highest concentration nationally. Most other metros have institutional ownership rates between 1% and 3%.
16. Mega institutions own 78% of all institutional SFR holdings
Among institutional investors, mega investors owning 1,000 or more properties control almost 446,000 single-family homes, representing 78% of all institutional SFR holdings. Institutional ownership remains highly concentrated among the largest players.
Demographics driving single-family rental demand
Demographic trends create the fundamental demand dynamics that support the single-family rental market. Understanding these patterns helps investors anticipate long-term market direction.
17. Millennials now number 74 million, the largest U.S. generation
U.S. Census Bureau data shows that Millennials totaling 74 million have overtaken Baby Boomers at 64 million as the largest U.S. generation. This cohort is now in their late 20s to early 40s, representing prime years for household formation.
18. The median age for first-time homebuyers reached 38 years
National Association of Realtors data indicates the median first-time homebuyer age is now 38 years old. Delayed homeownership extends the rental period for millions of households.
19. 70.4% of homeowners have mortgage rates below 5%
Federal Housing Finance Agency data shows that 70.4% of U.S. homeowners with mortgages have interest rates below 5.0% as of Q2 2025. This "rate lock" effect reduces existing home inventory as owners hesitate to sell and take on higher rates.
Housing affordability and supply dynamics
The affordability gap between homeownership and renting continues to widen, creating structural support for rental demand. These supply and affordability metrics help investors understand the long-term case for single-family rentals.
20. Home prices grew 156% since 2000 while income grew 99%
Federal Reserve Bank of St. Louis data reveals that median household income has grown 99% since 2000, from $41,990 to $83,672. Meanwhile, median home prices grew 156%, from $165,300 to $423,100, creating a widening affordability gap.
21. Monthly ownership costs exceeded rental costs in 2025
Moody's Analytics data shows the average monthly cost of homeownership for a median-priced home reached approximately $2,525 in April 2025, compared to $2,312 for single-family rental. This cost differential encourages many households to remain renters.
22. Rent-to-income ratio declined to 28.1% in Q1 2025
The national rent-to-income ratio has declined for six consecutive quarters to 28.1% in Q1 2025, approaching pre-pandemic levels. This improvement reflects wage growth outpacing recent rent increases.
23. A housing shortfall of 3.8 to 5.5 million homes persists
Estimates indicate a cumulative shortfall of 3.8 to 5.5 million homes in the U.S. housing market. This structural undersupply continues to support both home prices and rental demand.
Property management costs and operational considerations
Understanding the costs of professional property management helps investors evaluate whether self-management or third-party services make sense for their portfolios. These statistics inform decisions about property management approaches.
24. Property management fees average 8.49% of monthly rent
The national average property management fee is 8.49% of collected monthly rent for residential single-family properties. Fees typically range from 8% to 12% depending on services included and local market conditions.
25. Tenant placement fees range from 50% to 100% of one month's rent
Property managers typically charge 50% to 100% of one month's rent for tenant placement services. These one-time fees cover marketing, showing, screening, and lease execution for new tenants.
Investor sentiment and market outlook
Survey data from landlords reveals how property owners are responding to current market conditions and planning for the future.
26. 67% of landlords own single-family homes as their primary property type
A Baselane survey found that 67% of landlords identify single-family homes as the primary type of rental property they own. This confirms SFRs as the dominant asset class among individual real estate investors.
27. 71% of property investors expressed optimism about profitability
Heading into 2025, 71% of property investors expressed optimism about the rental industry's profitability. This strong sentiment reflects continued confidence in rental real estate as an investment strategy.
Managing single-family rental finances effectively
With single-family rentals representing the dominant property type for individual landlords, efficient financial management becomes critical as portfolios grow. The challenge intensifies when investors own properties across multiple LLCs or in different markets.
Traditional approaches using separate bank logins and multiple apps spread financial information across systems, making it difficult to track performance by property and entity. Baselane combines banking and bookkeeping in one platform, with advanced automation available through its subscription to assign transactions to the appropriate property, entity, and tax category using 120+ real-estate-specific categories.
For landlords collecting rent across multiple single-family homes, Baselane automates invoicing, payment reminders, and late fee calculations. Rent deposits flow directly into property-specific accounts, keeping operating funds separated from security deposits and reserve accounts. This organization becomes particularly valuable when preparing for tax preparation, as income and expenses are already categorized for Schedule E reporting.
Baselane also offers savings accounts with up to [v="apyvalue"] APY² and FDIC insurance coverage up to [v="fdic_long"]¹ through Thread Bank's deposit sweep program, giving investors a place to hold reserve funds for repairs, vacancies, and capital improvements.
FAQs
What percentage of single-family rentals are owned by institutional investors?
Institutional investors own approximately 3.8% of single-family rentals, representing about 574,000 homes. The vast majority, 89.6%, remain owned by individual landlords with 1 to 5 properties. Atlanta has the highest institutional concentration at 25% of local SFR stock, but most metros have institutional ownership rates between 1% and 3%.
How much did single-family rents grow in 2025?
Single-family rents grew 1.2% year-over-year as of December 2025, representing a significant slowdown from 2.5% growth in December 2024. This brought annual rent growth to 15-year lows. Performance varied substantially by market, with Chicago leading at 4.8% growth while Dallas experienced a 1.2% decline.
What are typical property management fees for single-family rentals?
Property management fees for single-family rentals average 8.49% of monthly rent, with typical ranges between 8% and 12%. Additional fees apply for tenant placement, usually 50% to 100% of one month's rent. These costs motivate many landlords to self-manage using technology platforms rather than hiring traditional property managers.
Why are more people renting single-family homes instead of buying?
The affordability gap between owning and renting has widened substantially. Home prices have grown 156% since 2000 while median income grew only 99%. Monthly ownership costs reached $2,525 compared to $2,312 for renting in April 2025. Additionally, 70.4% of existing homeowners have mortgage rates below 5%, reducing inventory available for first-time buyers.
What is the current housing supply shortfall in the United States?
The U.S. faces a cumulative housing shortfall of 3.8 to 5.5 million homes. This structural undersupply supports both home prices and rental demand. New permitting activity remains below the levels needed to close this gap, with June 2025 permits down 5.8% year-over-year across all housing types.