Earn up to 4.19% APY2.  No account fees. No minimum balances.

Accounting
built for rental properties

Save time and money by swapping your manual spreadsheets and expensive accounting software for accounting built for real estate investors – bookkeeping, analytics, reporting, taxes, and more.
A screenshot of a transaction management dashboard displaying a list of financial transactions. The interface shows transaction dates, payee names, payment descriptions, amounts, and categories. Some transactions are categorized as needs review or in progress.
Rental property tax-compliant
Real-time cash flow tracking
Auto-generated financial & tax reports
Trusted by 40,000+ real estate investors

Easy transaction management

No more manual accounting and data entry.  Sync all your rental property transactions in one bookkeeping platform built for real estate.
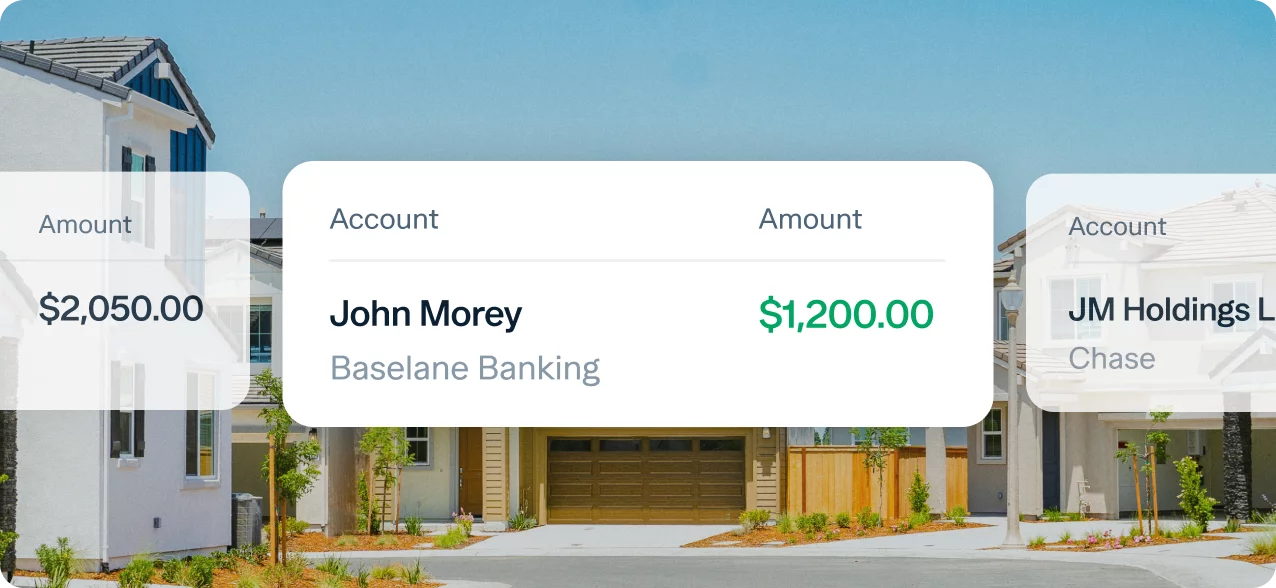
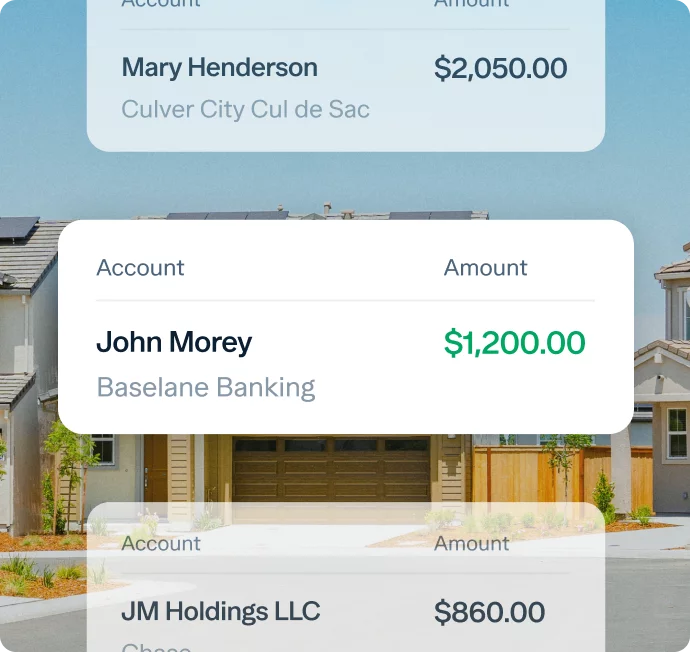
A screenshot of a financial app interface displaying account balances over a background image of a suburban neighborhood. The central account lists "John Morey, Baselane Banking" with a balance of $1,200.00. Other accounts show amounts of $2,050.00 and $0.
A digital interface displays account balances: Mary Henderson with $2,050.00, John Morey with $1,200.00 from Baselane Banking, and JM Holdings LLC with $860.00. A suburban neighborhood with houses is seen in the background.

All transactions synced in one place

One simple, consolidated ledger for all your Baselane banking & external account transactions, all automatically synced.

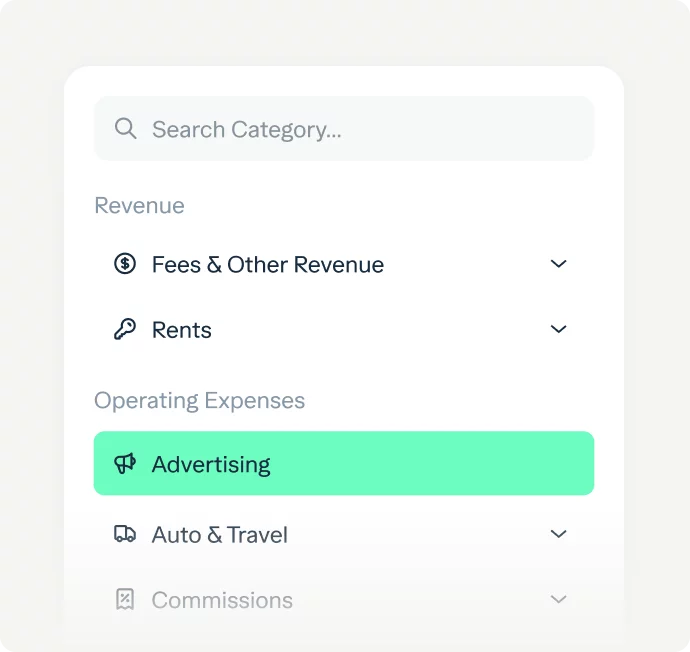
A financial management interface displaying a category search bar and options under "Revenue" and "Operating Expenses". Within "Revenue", "Fees & Other Revenue" and "Rents" are listed. Under "Operating Expenses", "Advertising" is highlighted in green.
A digital interface displaying a search bar labeled "Search Category." Below it, categories such as "Fees & Other Revenue," "Rents," "Advertising," "Auto & Travel," and "Commissions" are listed. "Advertising" is highlighted in green under Operating Expenses.

Compliant categorization

Accurately categorize your transactions with over 120 real estate specific categories and sub-categories based on Schedule E.
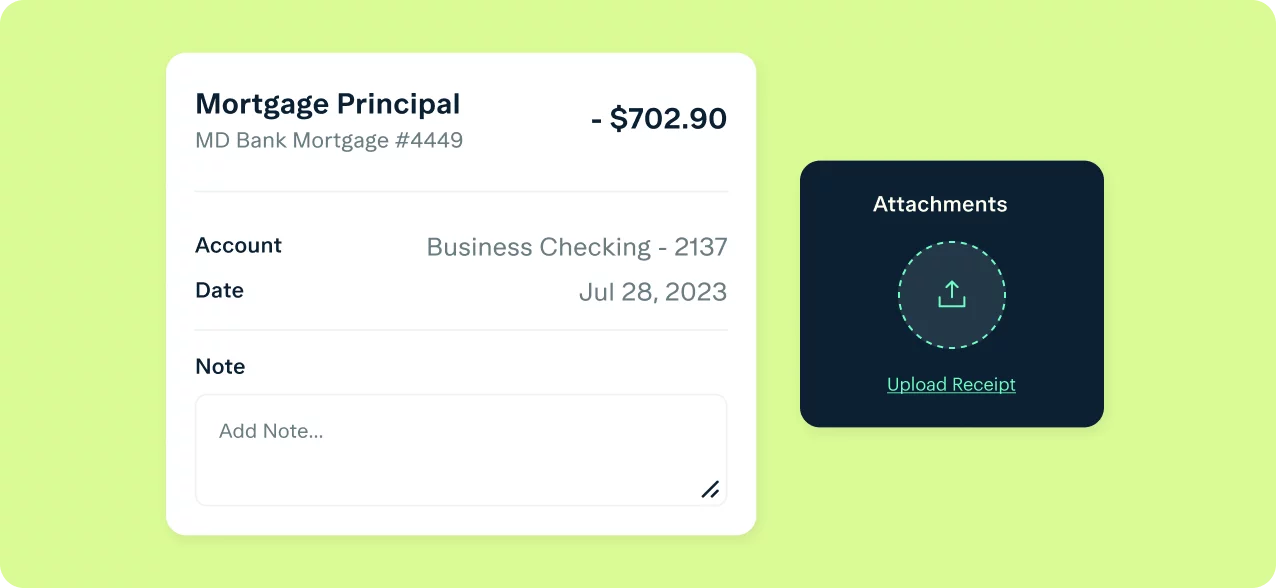
A screenshot of a transaction summary showing a payment of $702.90 for "Mortgage Principal" from account "Business Checking - 2137" on July 28, 2023. There is an option to add a note and a section for uploading a receipt under "Attachments." The background is light green.
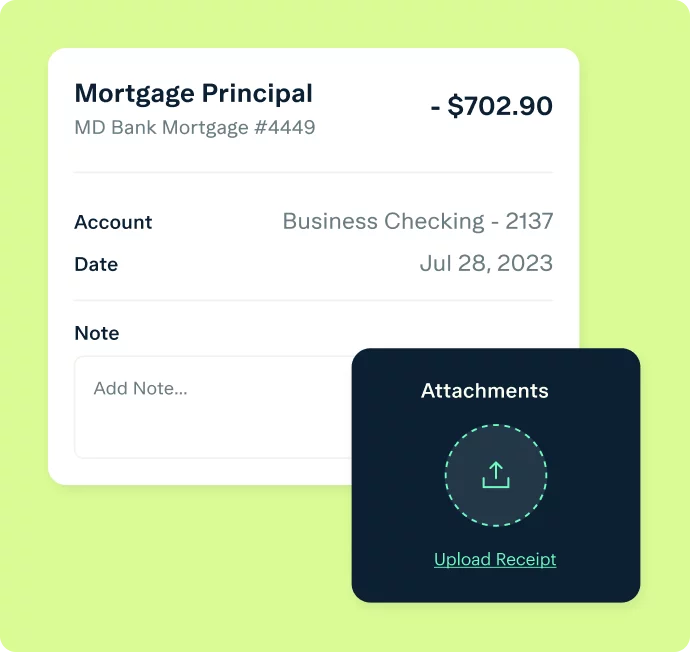
A digital interface displaying a mortgage principal payment of $702.90 from MD Bank Mortgage #4449. Payment details include: Account - Business Checking 2137, Date - Jul 28, 2023. There's a section to add notes and an "Attachments" section with an "Upload Receipt" button.

Organized receipts

Never lose a receipt again. Easily capture receipts and add notes so that you are effortlessly tax-ready.
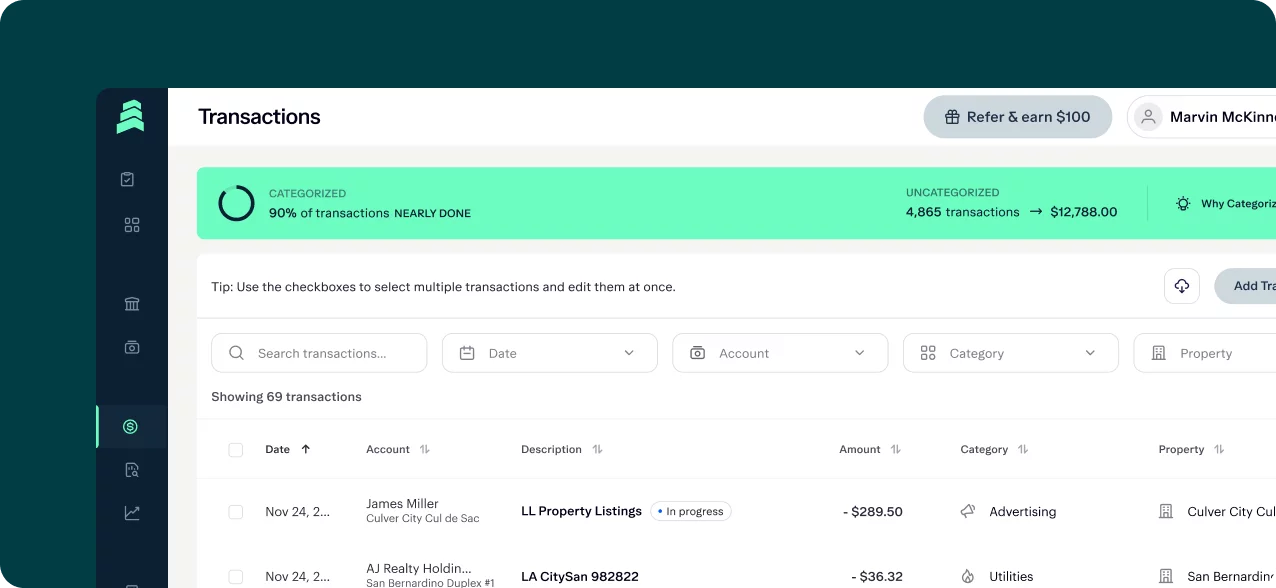
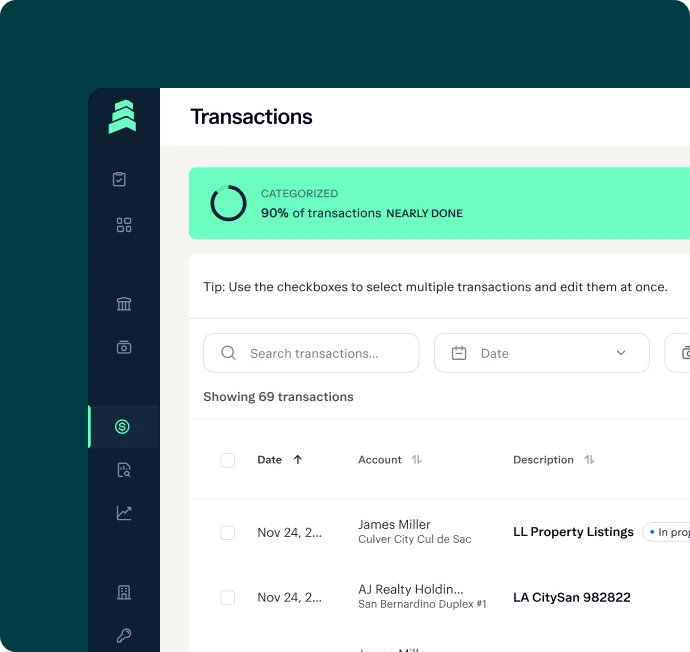
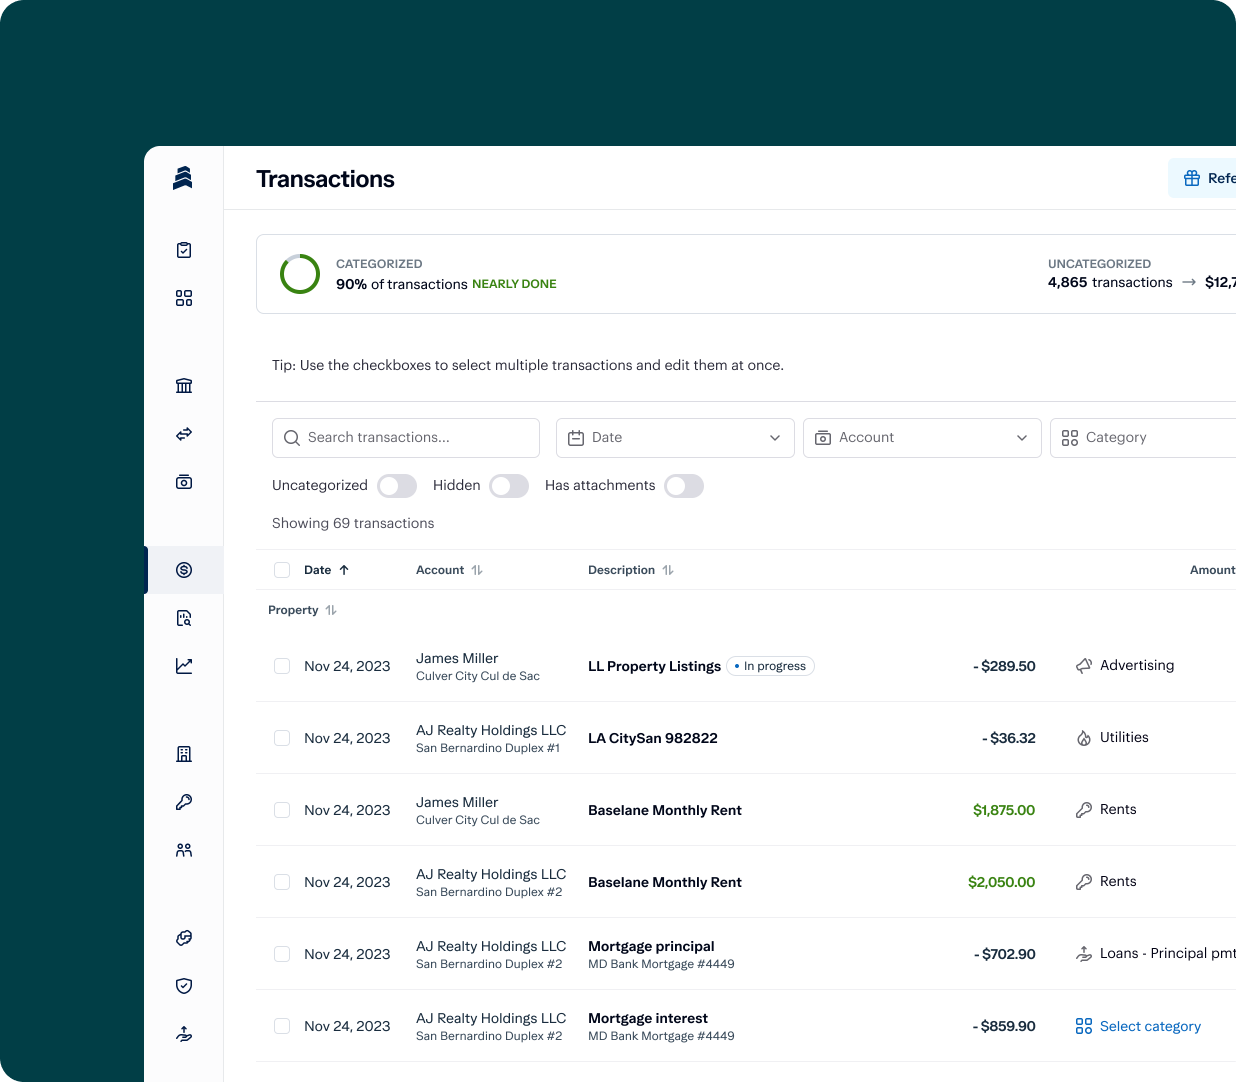
A dashboard screen shows categorized transactions, with a green banner indicating 90% of transactions are nearly done. Tabs for transactions, date, account, and category are visible. A list of transactions with details and statuses is displayed below.
A screenshot of a financial dashboard. The header reads "Transactions" with a green progress bar indicating "90% of transactions nearly done." Below is a list of transactions with columns for date, account, description, and location.

Built-in banking

Integrate with Baselane banking to get instant and precise transaction data. Forget about lost transactions, re-syncing external accounts that get disconnected, and data lags.

Abstract image of a symmetrical, curved black shape forming a 'V' pattern, meeting at a point in the middle of a white background. The black areas fade smoothly into the white space along the curved edges.

Accurate reporting for smart decisions

Run your numbers with confidence without the data crunching. Make the right decisions to grow your passive income.
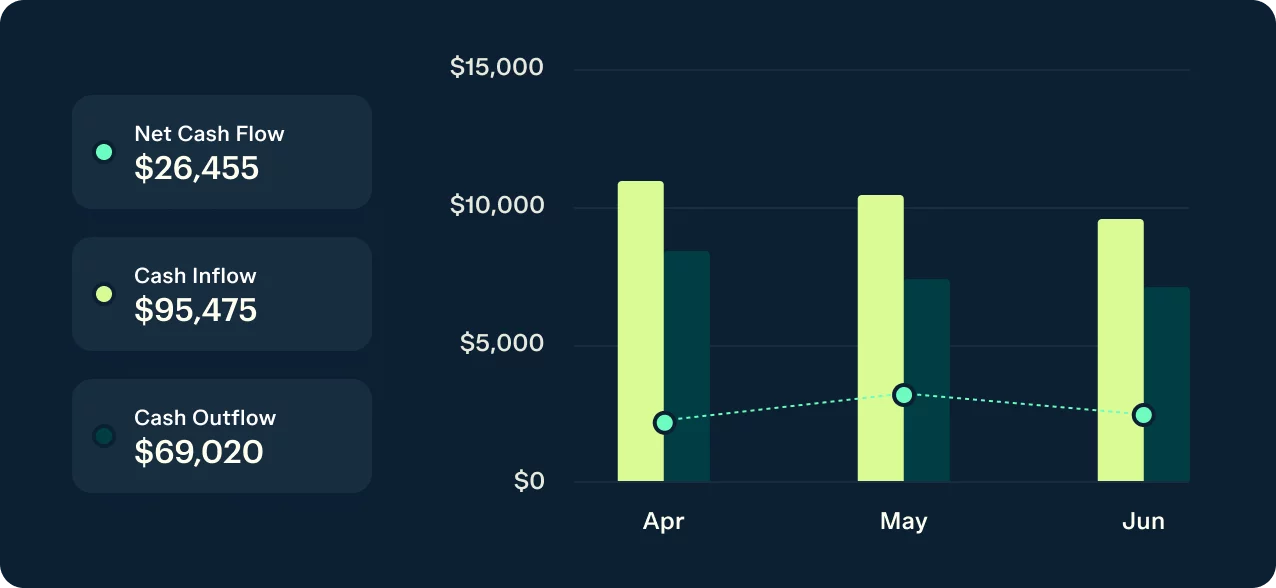
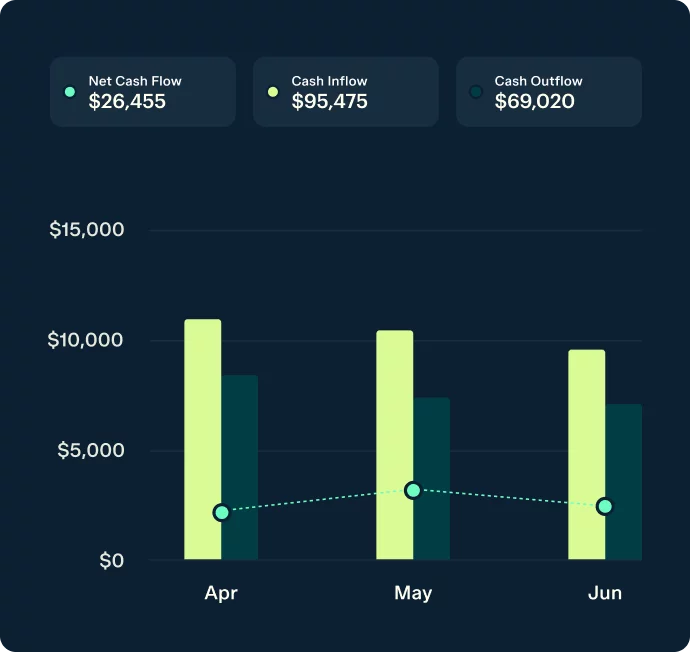
A dark-themed financial bar chart displays cash inflow, cash outflow, and net cash flow for April, May, and June. The left side shows net cash flow of $26,455, cash inflow of $95,475, and cash outflow of $69,020. Bars represent inflows and outflows per month.
A bar and line graph displaying financial activity from April to June. Each month shows cash inflow (light green), cash outflow (dark green), and net cash flow (dotted line). April: inflow ~$9K, outflow ~$4K. May: inflow & outflow $10K. June: inflow $9K, outflow $7K.

Real-time cash flow insights

Gain real-time insights into your cash flow with powerful tools that easily analyze income and expenses.
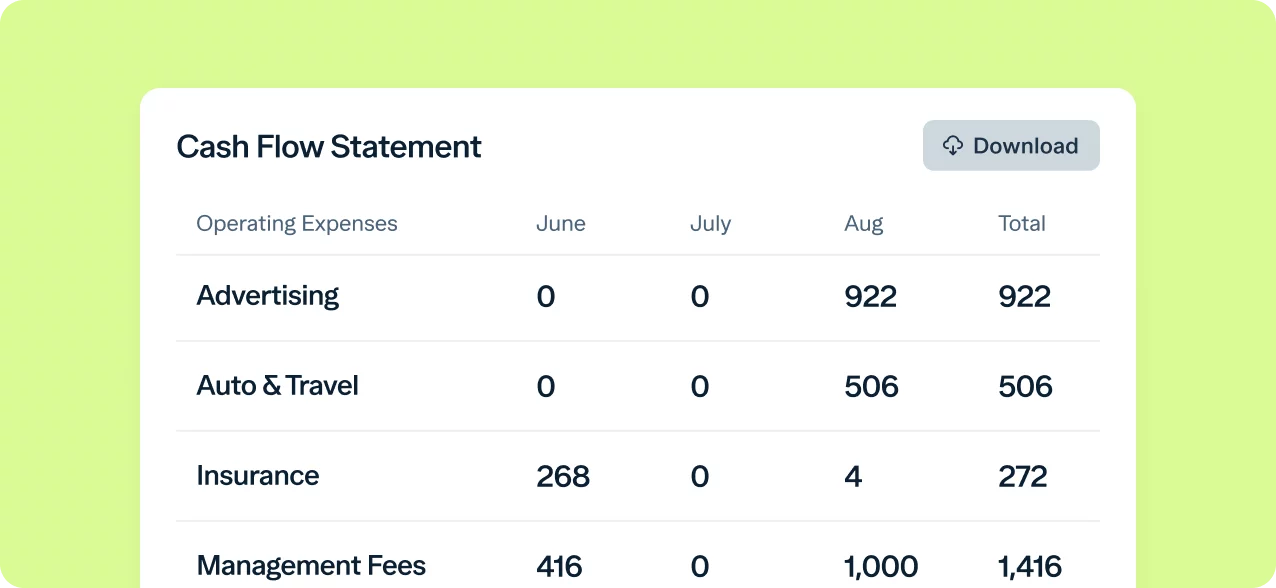
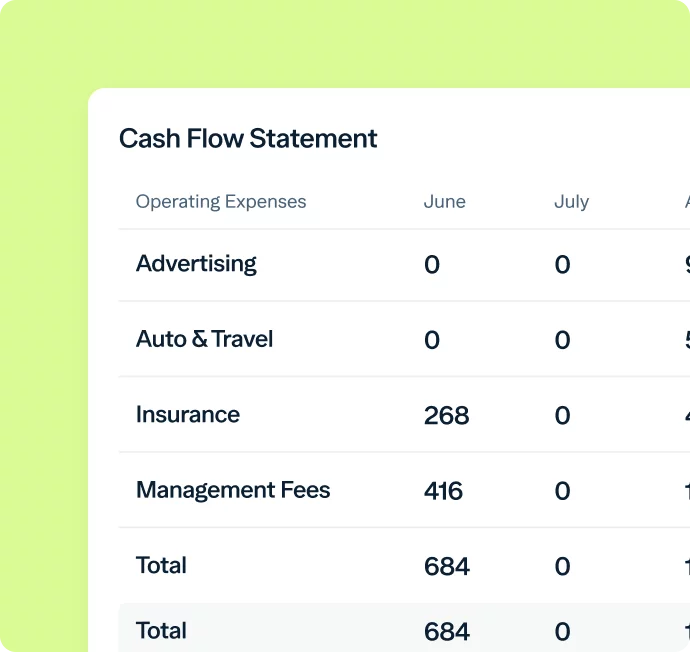
A cash flow statement table shows operating expenses for Advertising, Auto & Travel, Insurance, and Management Fees. Columns display values for June, July, August, and Total. A "Download" button is at the top right. Background is light green.
A cash flow statement showing operating expenses for June and July. Categories listed are Advertising, Auto & Travel, Insurance, and Management Fees. June's expenses total 684, with 468 for Insurance and 216 for Management Fees. No expenses are recorded for July.

On-demand financial reports

Get full visibility of your property performance with real estate-specific financial reports, including Income statements, Net Cash Flow statements, and many more.

Maximize tax returns, reduce busy work

No more stressing about taxes. Get accurate and automated reporting to make tax time a breeze.
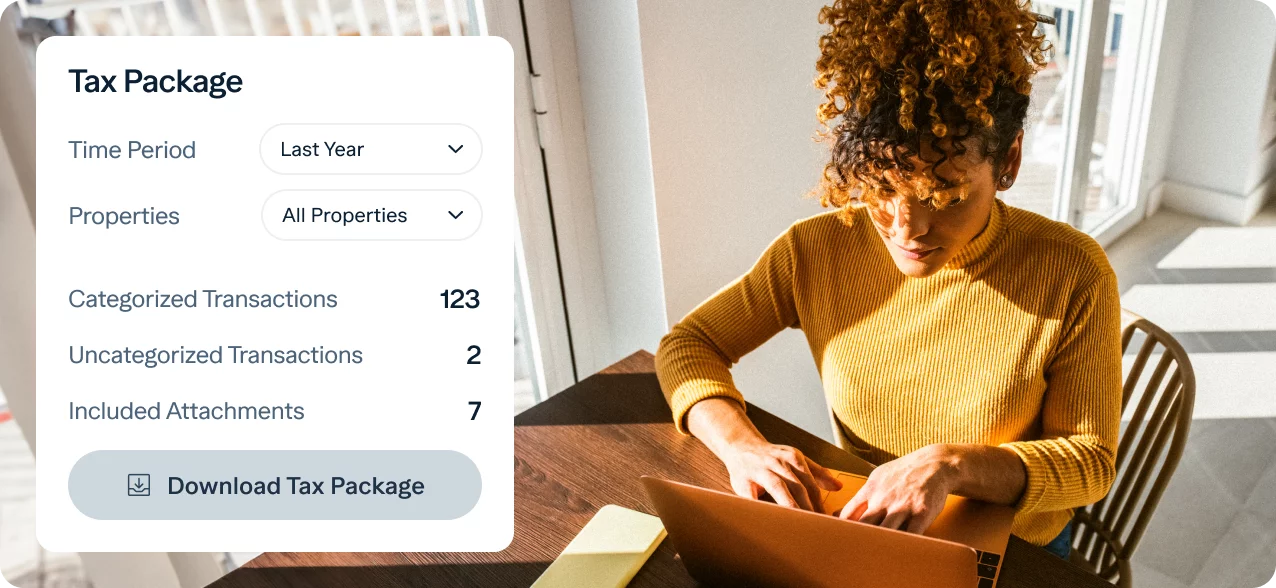
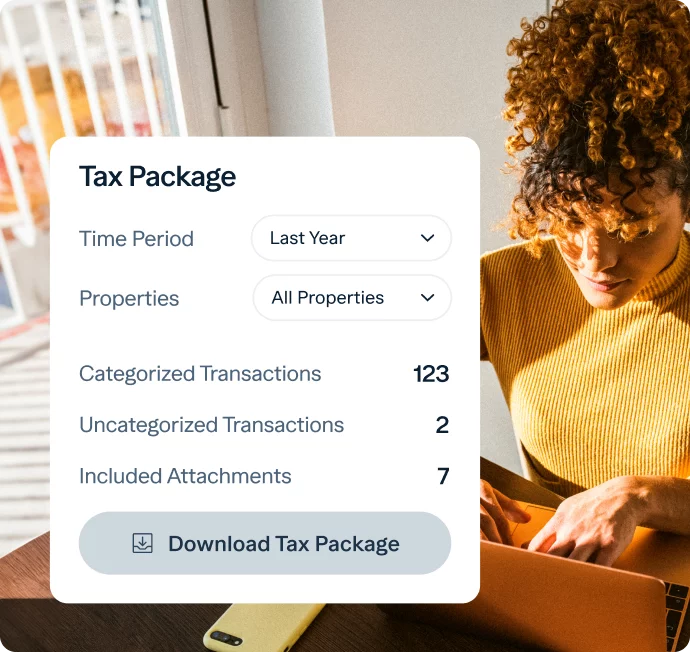
An individual with curly hair wearing a yellow sweater is sitting at a table using a laptop. A sidebar on the left displays a "Tax Package" summary with time period, properties, categorized and uncategorized transactions, included attachments, and a download button.
A person with curly hair is using a laptop at a table in a well-lit room. A pop-up window on the left displays a "Tax Package" with options and data: the time period is "Last Year", properties are "All Properties", categorized transactions are 123, uncategorized transactions are 2, included attachments are 7, and a button to download the tax package.

Accountant tax package

Save time for you and your accountant with a customizable and
downloadable tax package that includes an income statement,
transaction ledger, and captured receipts.

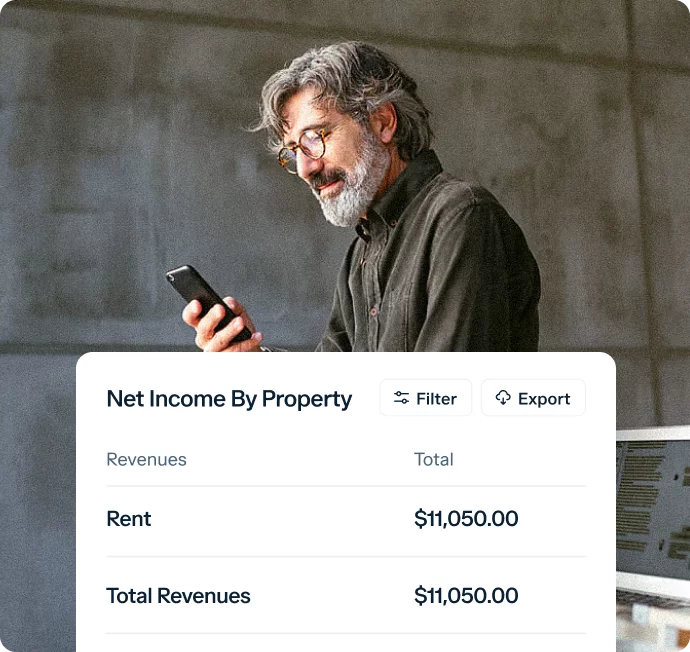
A person with graying hair and glasses, wearing a dark shirt, looks at their smartphone. Next to them is a chart titled "Net Income By Property," showing total revenues of $11,050.00, management fees of $280.00, and cleaning & maintenance costs of $2,115.00.
A man with gray hair and a beard wearing glasses is looking at his smartphone. In front of him is a table titled "Net Income By Property" showing revenues: Rent $11,050.00 and Total Revenues $11,050.00. Options to filter and export data are visible.

Schedule E reporting

Auto-generate Schedule E reports at the click of a button.

Trusted by 40,000+ real estate investors

*Actual results may vary by customer.

SEE HOW WE STACK UP

SMB Accounting Platforms
Built for Real Estate Investors
Pricing$0/month$30-200/month (Quickbooks)
120 Real Estate Specific Income & Expense Categories
Property & Unit Level Tagging
Built-in Banking for Instant and Accurate Transaction
Income Statements by Property & Unit
Advanced Real Estate-Specific Reporting
Schedule E Reporting
Account Tax Package by Property
Integrated Rent Collection
Integrated Tenant Management
Dedicated Customer Support
Integrations

CONNECT TO THE TOOLS YOU USE EVERY DAY

Real support from real humans

Schedule a call, send an email, or chat live with our customer support experts who speak real estate.

Get dedicated support anytime, anywhere. Our customer support experts speak real estate.

Chat
Phone
Email

Ready to make the switch?

Over 40,000 real estate investors use Baselane to save time managing their property finances and grow their rental portfolio.

Enter your email to get started